 Diabetes Care Community Learn, connect and care

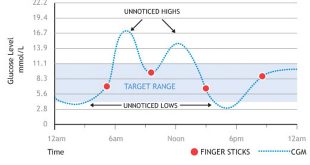
Continuous glucose monitoring (CGM) is a new technology in diabetes management that reports glucose levels on a regular basis, as often as every five minutes. Because a CGM device monitors interstitial glucose continuously, it lets you see what’s happening between fingerstick tests. That way, you can watch for glucose trends and patterns that you wouldn’t likely see with traditional blood glucose testing. For example, a CGM system provides you with the ability to identify trends in levels over the long-term which normally go undetected, such as changes in glucose levels while sleeping, between meals, and during and after physical activity.
(For more information about CGM basics, click here.
So, what to do with the information from your CGM device once you’ve gathered it? The most important thing you can do when interpreting continuous glucose monitoring data is to find the patterns that are occurring with regard to your glucose levels; primarily, this means looking for lows or highs that are occurring at the same time on multiple days.
Once you find the pattern, you can take the following actions:
- Determine where you lows are: fix them first!
- If you have overnight lows, fix them, and then move on to dealing with lows at other times of the day.
- For post-meal high readings, consider adjusting your insulin to carbohydrate ratio.
- For lows after exercise, consider altering your physical activity routine, or make adjustments to your insulin and carbohydrate intake before and after exercising.
Box Plots
A box plot is a convenient way of graphically depicting groups of numerical data, in this case your glucose readings. Below, we’ll show you some examples of CGM box plots. A standard day box plot report (Figure 1) shows your chosen time frame, and collects the readings into hourly groupings.
Figure 1. Standard day box plot report
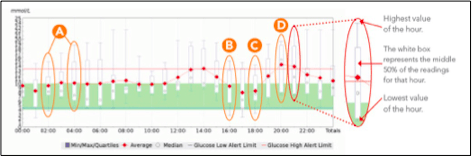
(A) The range at 02:00 shows a shorter box length compared to the 04:00 range. This means that the glucose at 02:00 has fewer fluctuations, which is often referred to as “less glycemic variability.”
(B) The average reading for 16:00 (represented by the red diamond) is within target at 9 mmol/L, but the glucose range end points display significant glycemic variability for that time frame. This highlights that sometimes the average alone does not show the entire picture of glycemic control.
(C) and (D). This example shows how quickly you can identify changes to your blood glucose after eating a meal. This helps you assess your insulin to carbohydrate ratio, or even your carb counting at each meal, by observing the post-meal trend. The meal is taken at C, and you can identify the rise 2 hours afterwards in D. In this example, dinner is assumed to be at 18:00 (6:00 pm).
Figure 2 provides information regarding prioritizing your assessment of your monitoring results.
Figure 2. Quick steps for prioritizing your CGM report review
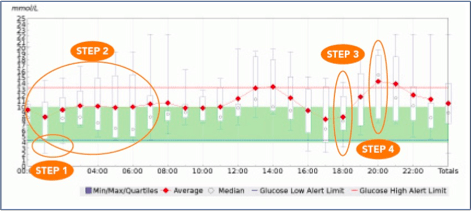
Step 1: Identify areas of hypoglycemia (first priority).
Step 2: Assess overnight glycemic control.
Step 3: Assess before meal glycemic control.
Step 4: Assess after meal glycemic control.
Tips regarding Identification of glucose trends from reports
- In the standard day box plot, work towards having the box within your target range, with less than 5% of glucose values in the hypoglycemic range.
- Ensure your targets are realistic: speak to your healthcare team about targets that are right for you.
- Look at a maximum of seven to 30 days when identifying glucose patterns.
- Keep in mind that insulin action is not immediate, and takes almost 2 hours to peak.
- Make one change at a time, and make these changes in small steps.
- Always consult your healthcare team before making any adjustments!
Effects of CGM on hypoglycemia and A1C levels
To assess the effectiveness of CGM with regard to hypoglycemia events and A1C levels in people with type 1 diabetes, researchers studied 120 people who were on intensive insulin therapy; the study participants were randomly assigned to perform conventional blood glucose monitoring with a meter, or to perform real-time CGM for 26 weeks. The group that performed CGM had fewer hypoglycemia episodes and lower A1C levels.
This article has been made possible by an unrestricted educational grant from Animas Canada.